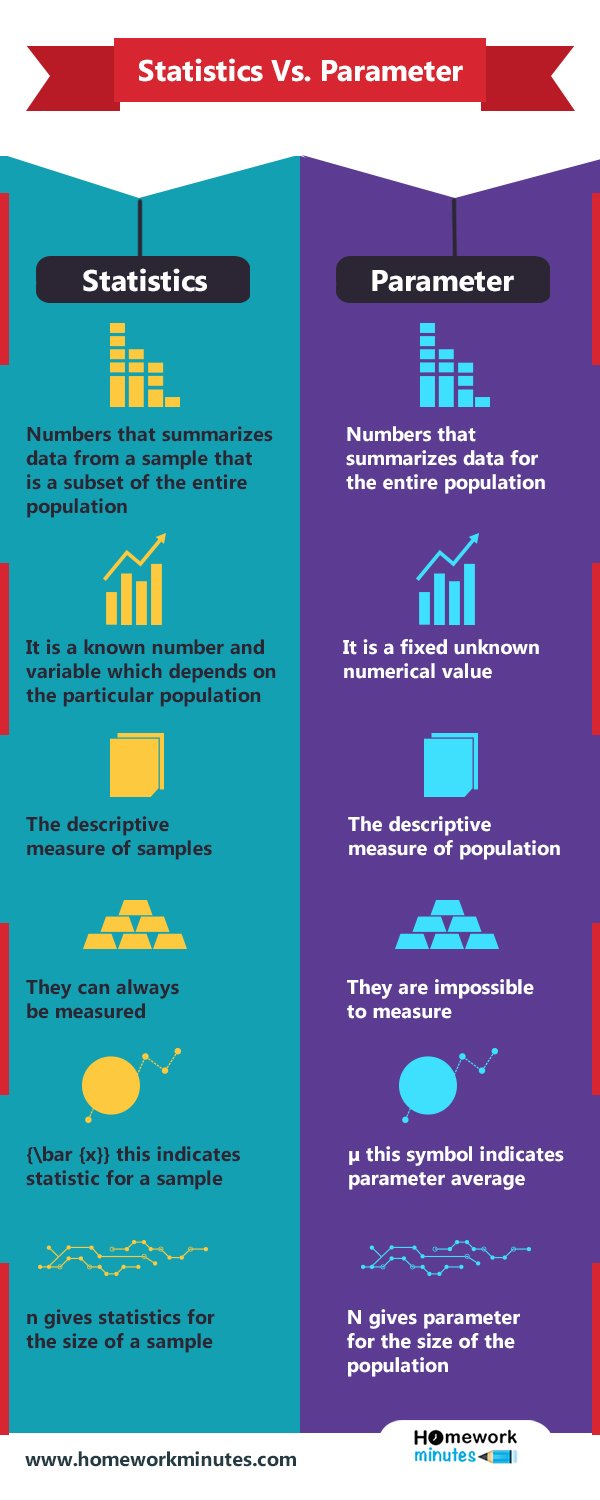
Here we are discussing statistics vs. parameters that are essential for the determination of size. Since many people have trouble while understanding the differences between statistics and parameters. But it is essential to know what are the measures and how to distinguish between them.
The statistics and parameters are very similar. They both are descriptions of the groups. The main difference between statistics vs. parameter is that the statistics describe a sample while the parameters describe the entire population.
For example, suppose, in an election, you find out that 66% of voters are planning to vote for a candidate. There are statistics. Since you only asked from a small population who are they voting.
In the other case, you asked in the class who all likes vanilla ice cream. Suppose 90% of students raise their hands. Thus it is a parameter since you asked everyone in the class.
Statistics
Summarizes Data
Statistics are numbers that summarize data from a sample that is a subset of the entire population.
Numerical Value
It is a known number and variable which depends on the particular population. It collects data without actually counting or measuring every individual in the population.
Descriptive Measures
The descriptive measure of samples within the population. Besides this, you can use statistics to estimate your confidence in the calculation.
Measurable Scale
They can always be measured to obtain an estimate of the population parameters. Since it is the descriptive value of some attribute of a population.
Symbolic Representation
x̅ (x-bar), this symbol indicates statistics for a sample. The sample proportion represented by p̂ (p-hat), s2 represents variance, n represents the sample size, and sp represents standard error of proportion.
Parameter
Summarizes Data
Numbers that summarizes data for the entire population, based on all the factors within that population. For example, you ask all the employees in a factory if they would like to eat pasta in lunch and 70% of them said yes, then you get a parameter here.
Numerical Value
It is a fixed, unknown numerical value. It helps in calculating the mean and average of the particular population.
Descriptive Measures
The descriptive measure of the entire population. Two parameters can measure a bell-shaped curve of the population.
Measurable Scale
They are impossible to measure, especially in the wild, where there are too many individuals. But they can be calculated in a small population.
Symbolic Representation
µ this symbol indicates parameter average, where p represents the population proportion, N represents population size, Greek letter sigma represents standard deviation, and σp represents standard error of proportion.


